Introducing Alert Analytics: A New Way to Understand Your Environment

Verkada Air Quality Sensors help customers monitor spaces where cameras cannot be deployed and get insight into environmental conditions that cameras cannot detect. From protecting school bathrooms against bullying and vaping to gathering real-time insight into air quality conditions like carbon dioxide levels, Verkada sensors enable customers to more comprehensively manage and protect their environments.
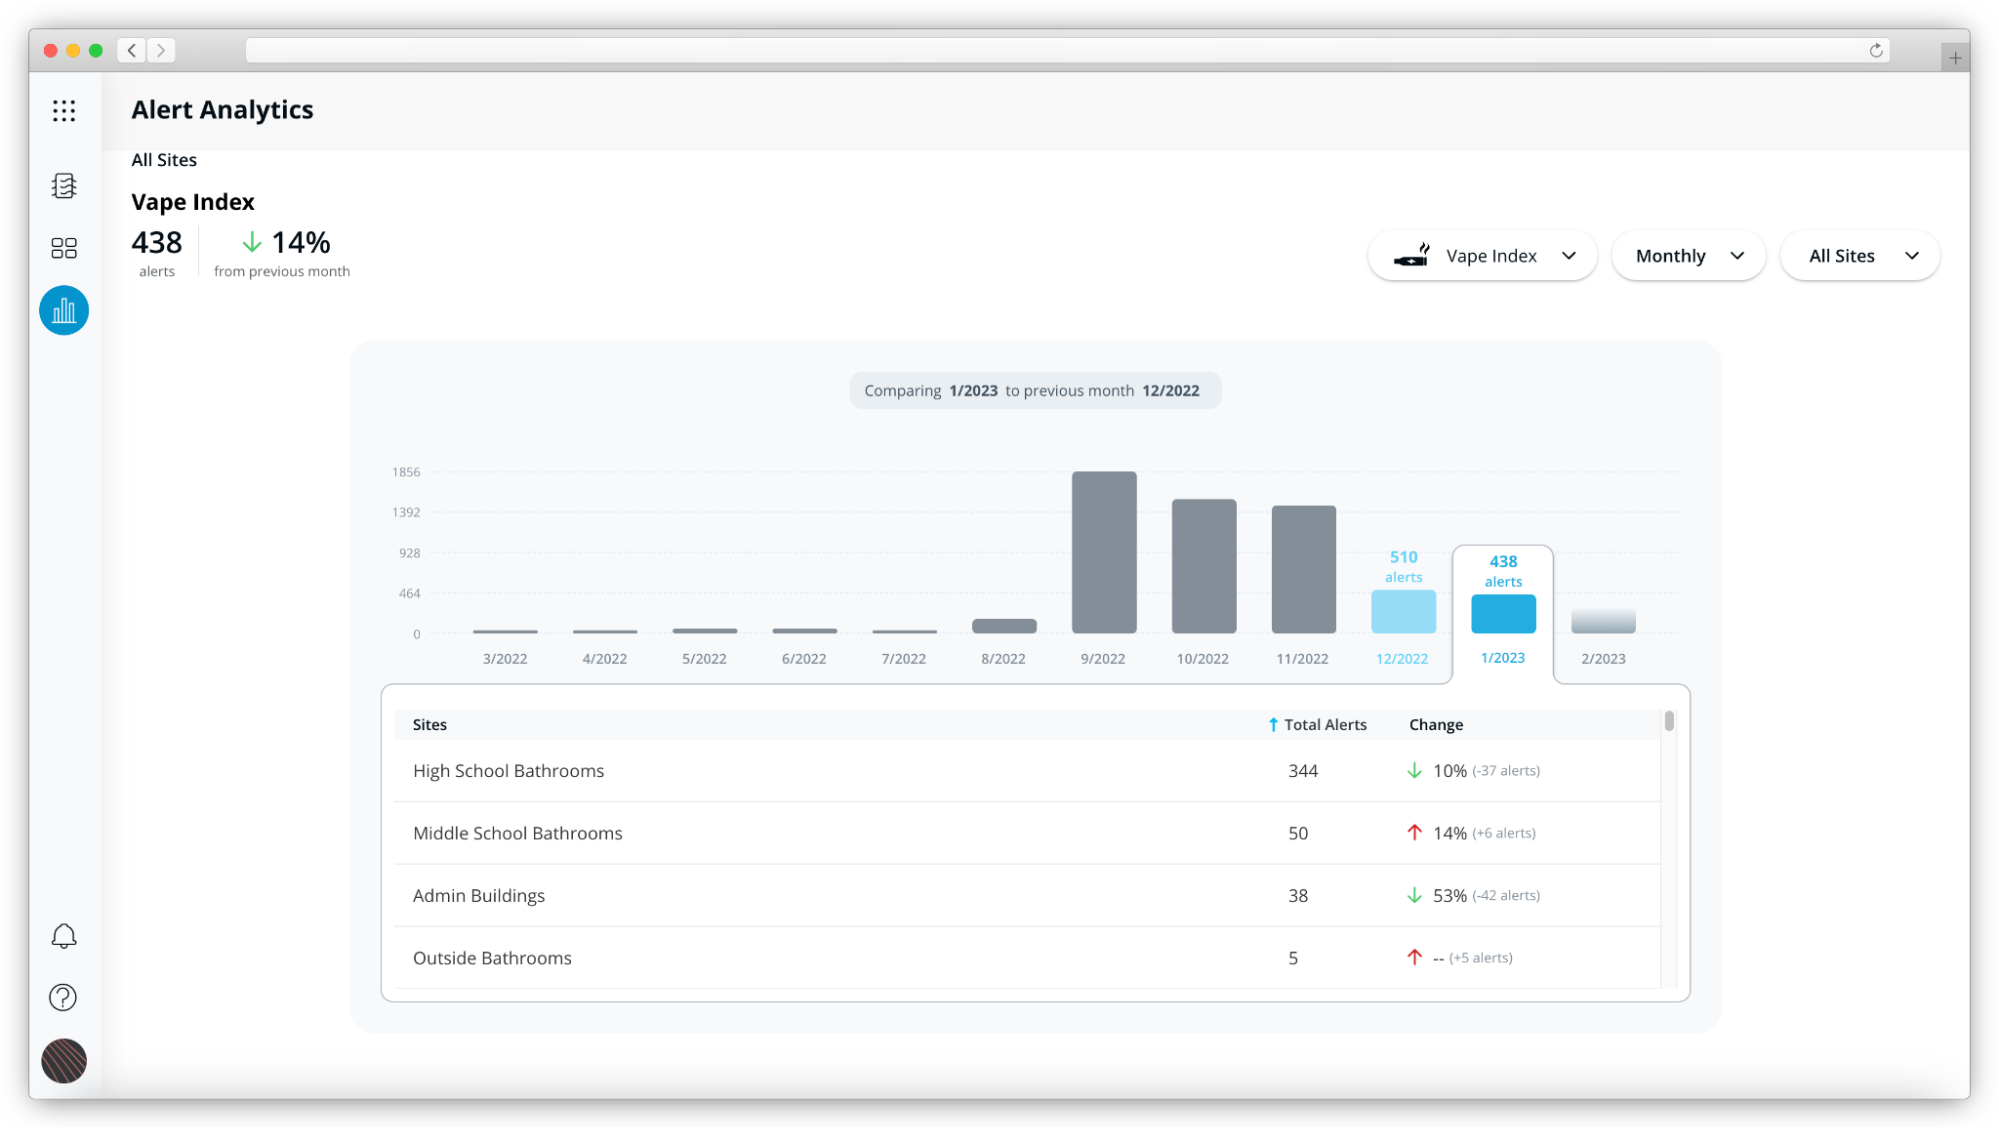
To better understand how environmental conditions change over time, we are excited to announce Alert Analytics. Alert analytics is a new tab that can be accessed from the lefthand navigation bar from the sensors home page. This dashboard gives admins the ability to view alert trends across all of their sites, devices, and sensor readings to identify areas for operational improvements. By pulling data across sensors together in a single intuitive dashboard, alert analytics provides actionable data in a digestible format.
Here is a short demo showing Alert Analytics in action.
Insights Across Industries
The new alert analytics page will give users a powerful way to view and understand data from their environmental sensors, as well as a powerful way to capture insights and trends in real-time.
Real-world use cases include:
School districts looking to protect bathrooms from bullying and vaping can use the alert analytics page to understand if their mitigation efforts are working.
Manufacturing customers can identify which areas of their facility have the highest noise levels and ensure those workers have the appropriate hearing protection.
IT administrators can now understand which server rooms have the most temperature alerts to understand if they’re cooling solution is working or not working as expected.
Diving Deeper
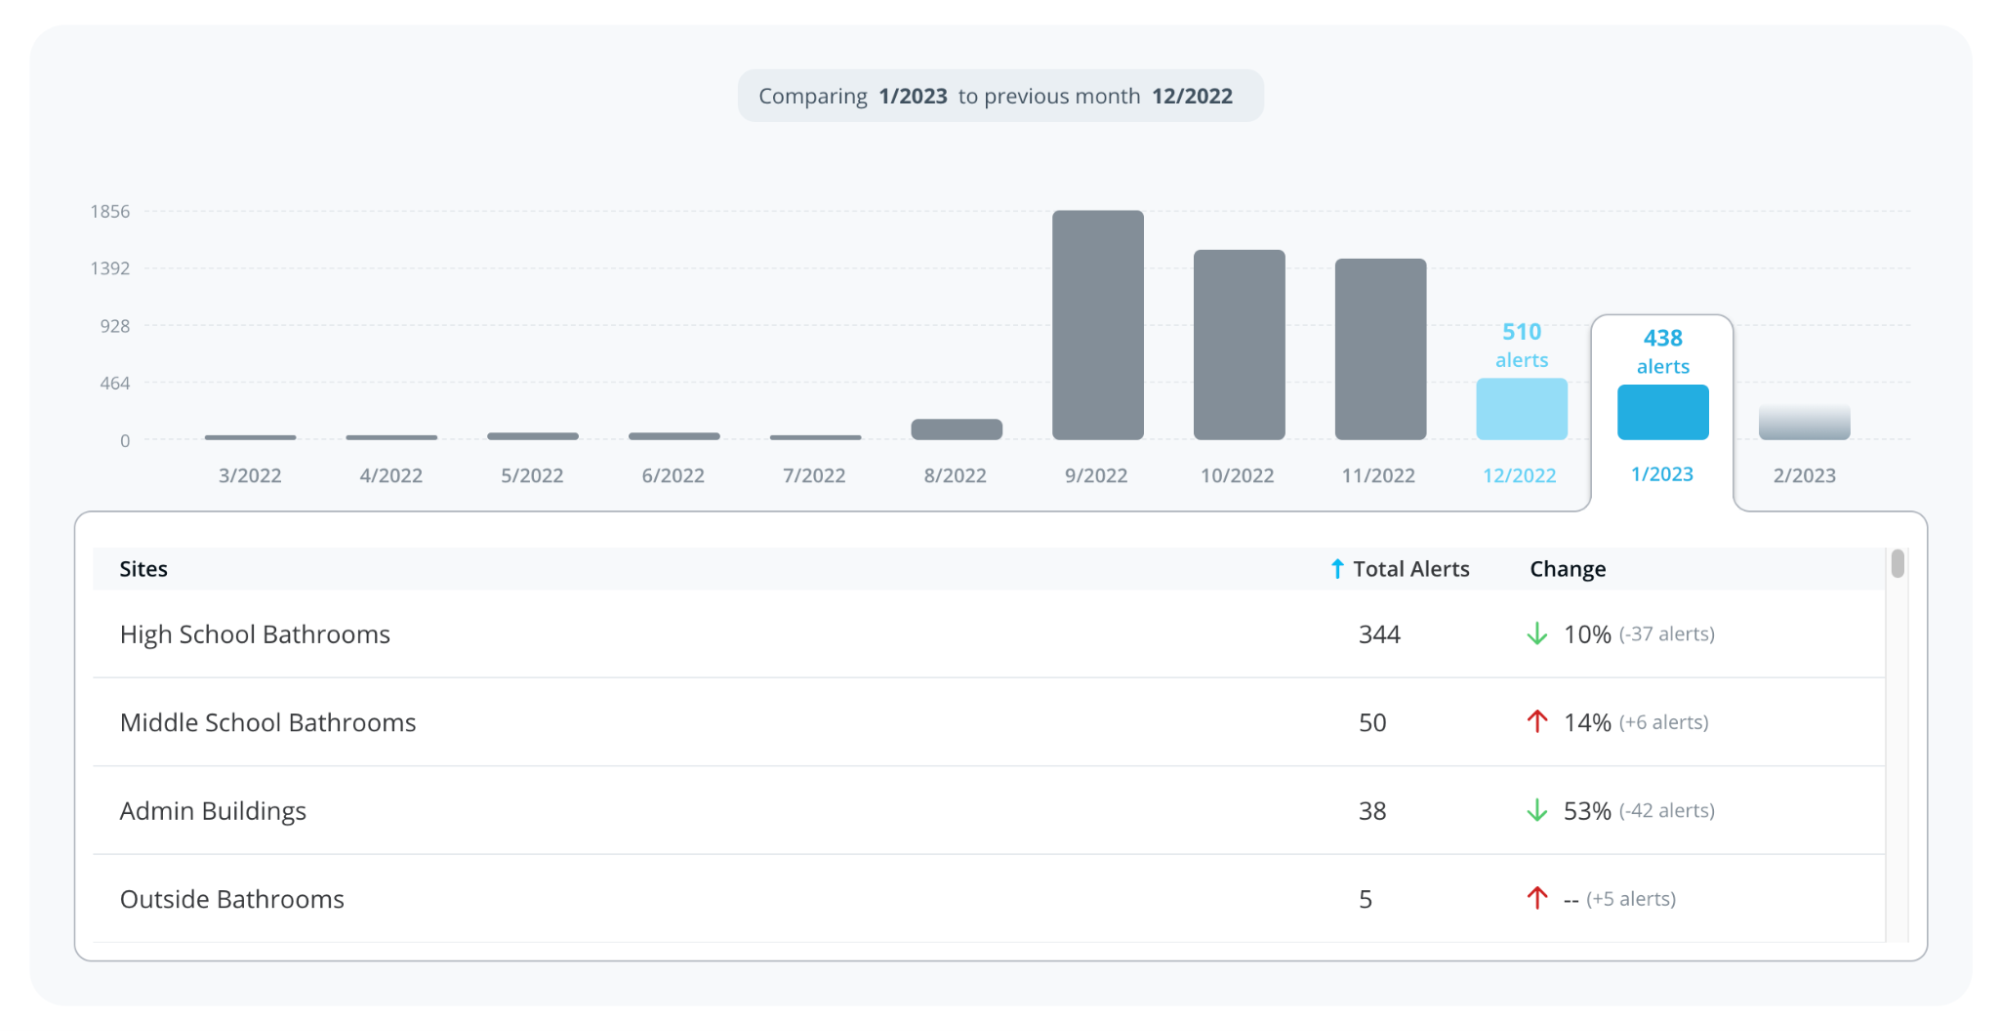
The Alert Analytics page gives users the ability to see how their facilities are performing, and drill into specific sites, zones, or devices for further investigation. Users can specify the sensor readings they’d like to evaluate, the time interval of the alert (daily, weekly, monthly), and fine-tune the selected sites or devices. Once configured, users will be able to see alert trends in an easy-to-use graph that is available right in Command. The table shows which site or device contributed the most to the selected column in the bar chart. From here, users can drill into the data to find problematic areas, allowing users to allocate resources to those areas.

Customer Traction
Verkada sensor customers are already using alert analytics for a range of use cases, including identifying trends across spaces in their school environments.
"With Alert Analytics, our school principals can now easily look at alert trends to identify which bathrooms see the most vape and possible bullying activity over time," says Scott Buller, Director of Information Technology at Paso Robles Joint Unified School District. "This helps us reallocate resources to these areas and better use alert analytics to understand if our mitigation efforts are working."
Customers love the simplicity and usability of alert analytics, which provides actionable insight that customers are able to use to measure and track programs and strategies.
"With Alert Analytics, I'm no longer having to create spreadsheets to identify problematic bathrooms. I can send administrators and stakeholders directly to the Alert Analytics page where they can analyze the data themselves." says Dan Kane, current sensors customer and Network Administrator at Marengo Community High School. "We've already used this feature to shut down two bathrooms with high activity, and drive students to a different, more manageable bathroom where our staff can keep an eye on the students."
Learn More
To learn more about how to use Air Quality Alert Analytics in your organization, please view the Help Article.
Want to learn more about how Verkada can help you monitor your environment across your sites? Register for a live webinar!


